Data Monitoring
The Data Monitoring page is designed to enhance the management and monitoring of Data Check-in pipeline issues, mainly focusing on identifying and analyzing failed executions. You are provided with a clear and comprehensive view to monitor the health and performance of your or your organization’s Data Check-in pipelines. Through this page, you can check the number of Data Check-in Pipelines that have failed out of the total created and executed by you or your organization. It also shows the number of Resolved Pipelines out of the ones that failed, giving insight into the resolution effectiveness. Additionally, detailed information on the occurrences of failed executions and the average execution time per pipeline are also presented.
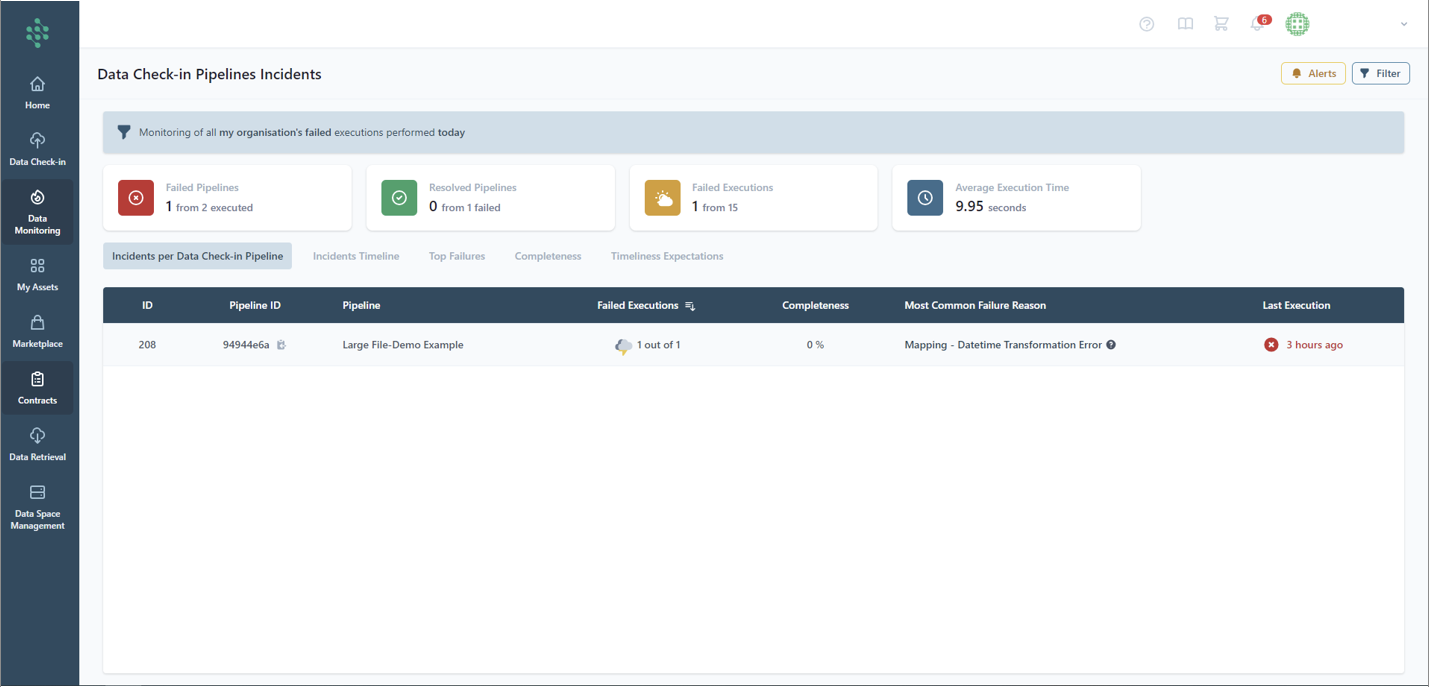
The Data Monitoring page comprises multiple tabs, each providing distinct insights into the performance and dependability of the Data Check-in pipelines developed by you or your organization. This tab offers in-depth information on particular failures, such as the Failure ID, the implicated Data Check-in pipeline, the failed executions number, the failure reason and the timing of the incident.
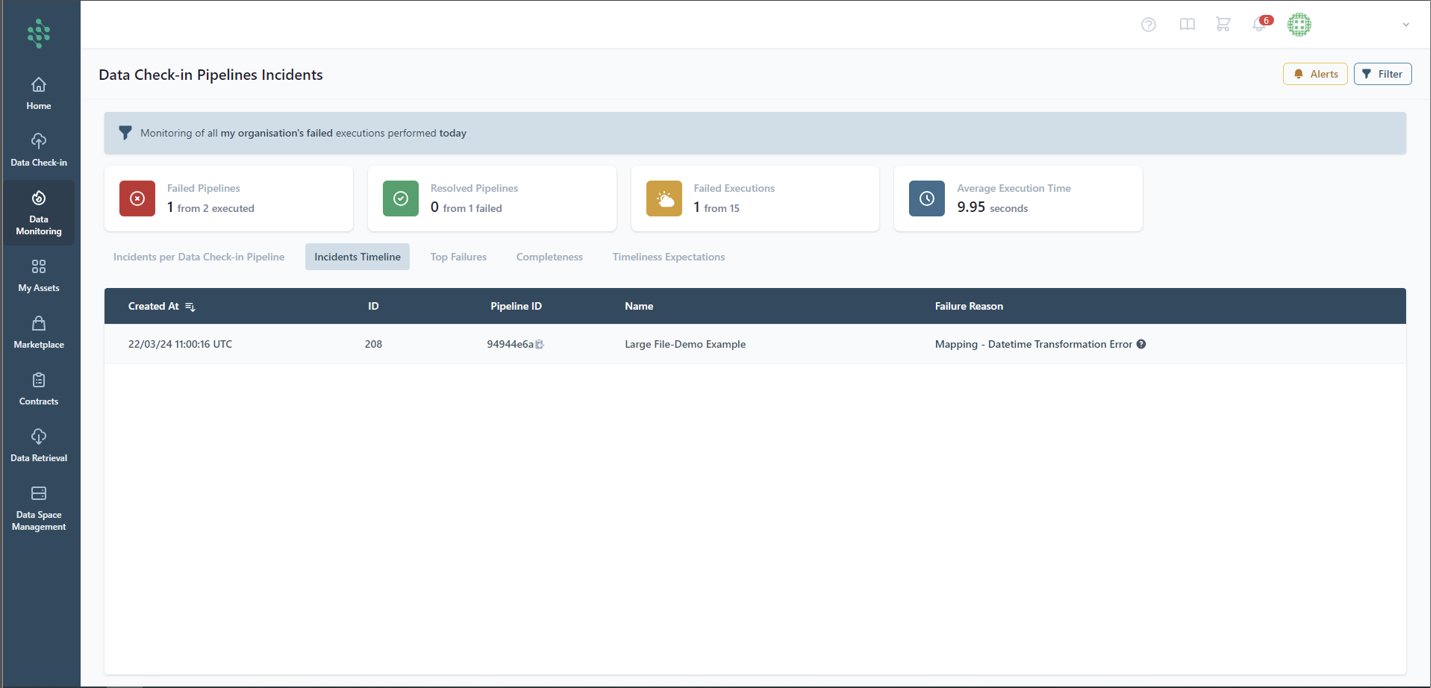
The "Incidents Timeline" tab on the Data Monitoring page displays a chronological overview of pipeline failures, categorizing them by their creation time, ID, Data Check-in Pipeline ID, the name of the pipeline, and the reason for the failure. That way, you can quickly understand the history and specifics of the respective Data Check-in pipeline issues, aiding in the effective analysis and resolution of problems.
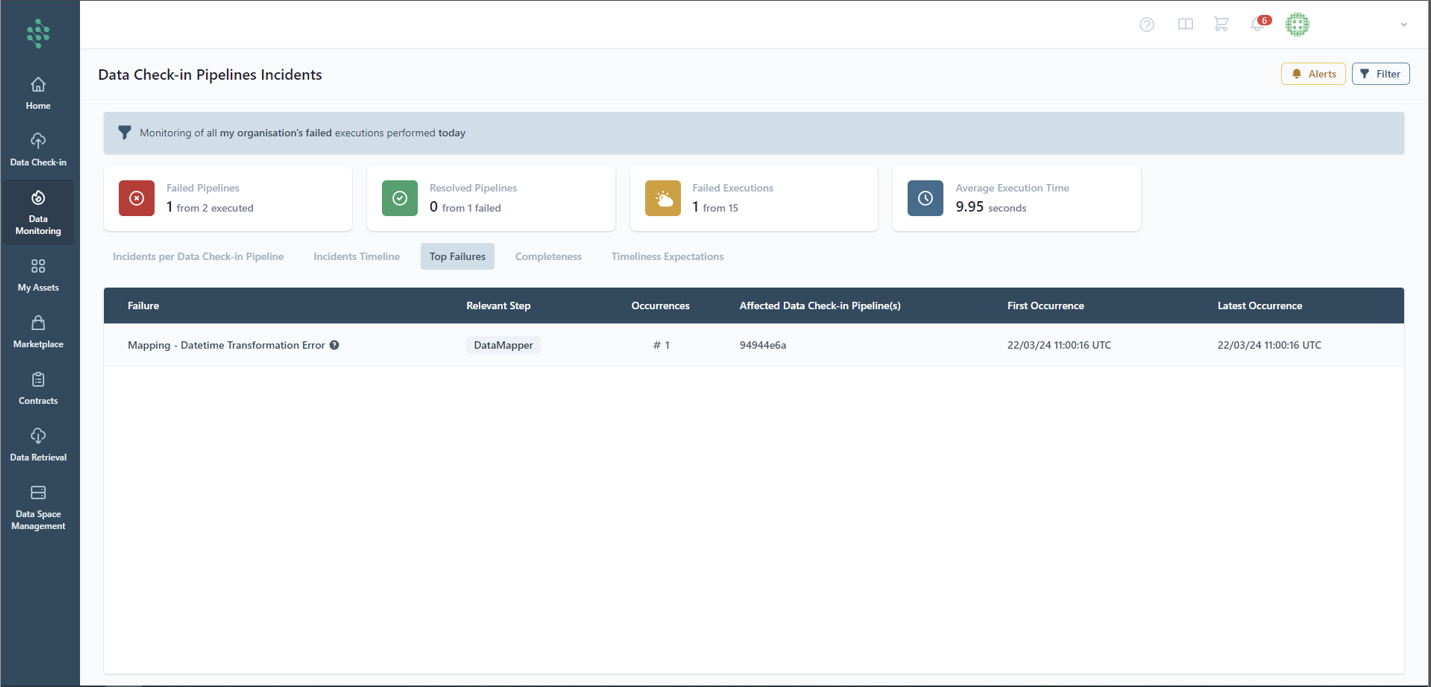
The "Top Failures" tab provides you with a comprehensive analysis of the most significant pipeline failures. It includes details such as the nature of the failure, the step in the pipeline where the failure was most relevant, and the number of times the failure occurred. Additionally, it lists the Data Check-in Pipeline(s) that were affected by these failures, along with the dates of the first and most recent occurrences.
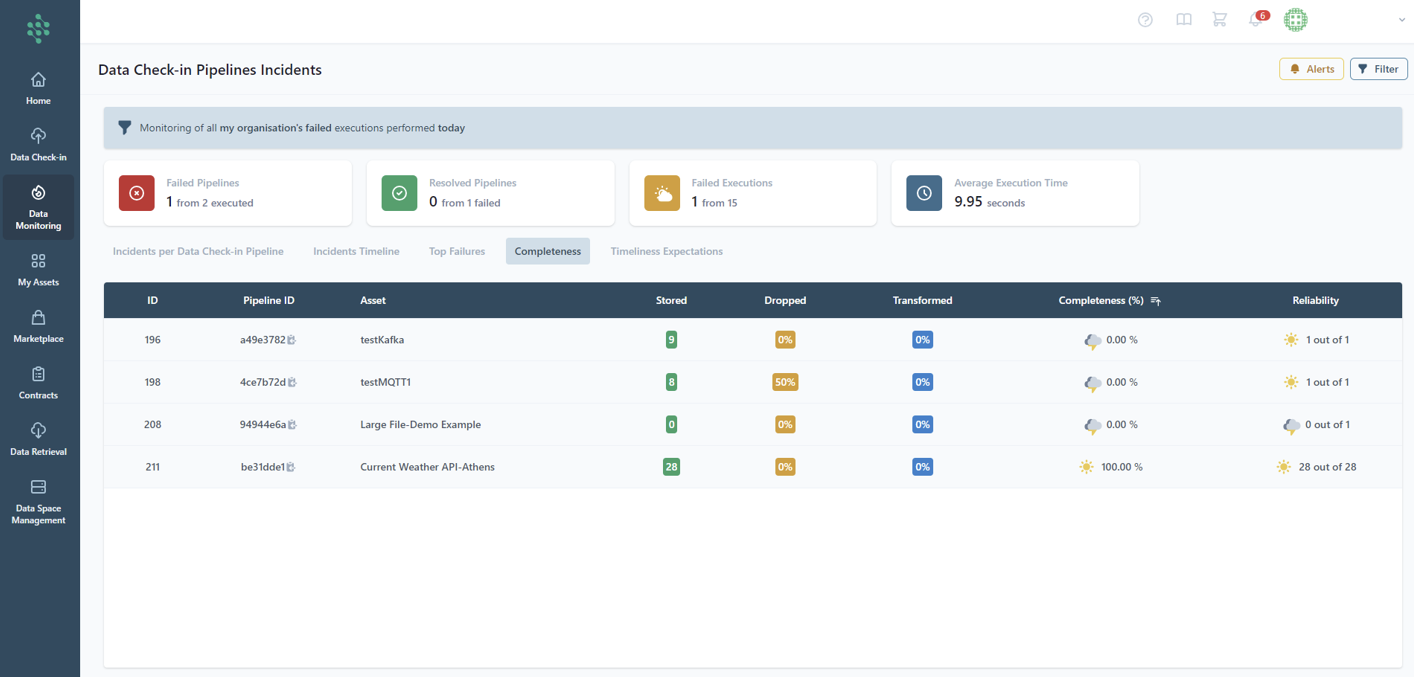
The "Data Completeness" tab delves into how thoroughly your data has been processed via the Data Check-in pipelines, concentrating on the instances where data was either successfully stored on the platform or dropped. Moreover, this tab sheds light on the data transformation percentage throughout the pipeline's operation. It also details the data completeness as well as the reliability of the pipeline, defined by the percentage of successful executions that have managed to load data into the asset relative to the total number of expected executions.
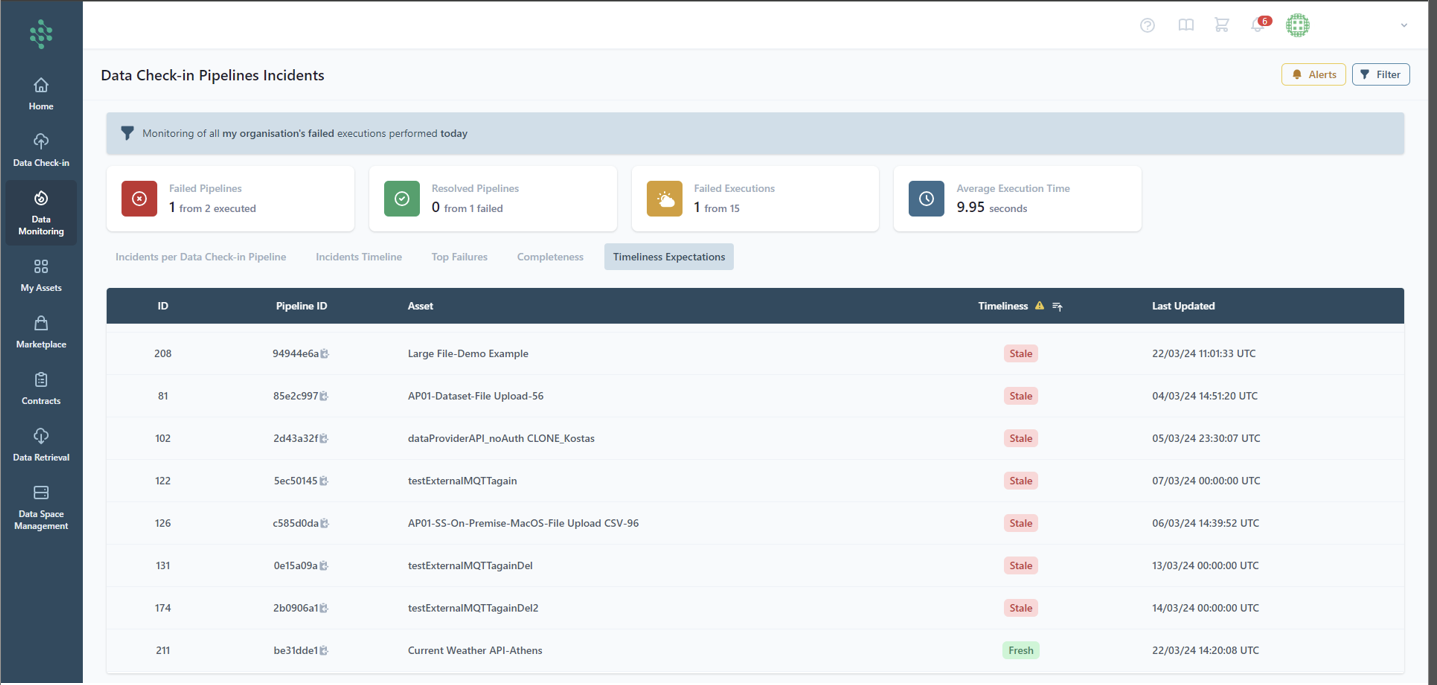
The "Timeliness" tab assesses the freshness of the data, distinguishing between pipelines that are updating data as expected ("Fresh") and those that are not ("Stale").