Home
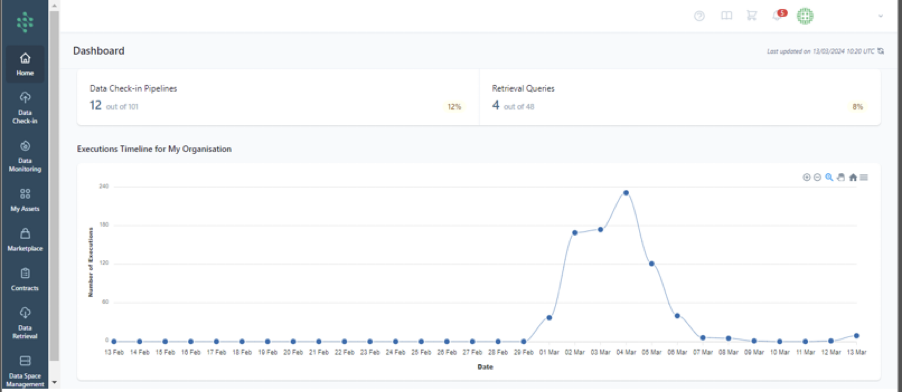
The dashboard provides a concise overview of the latest usage analytics related to data management and processing activities within the SYNERGIES Platform. It serves as a centralized hub for users to quickly assess the status and performance of various assets and operations tied to their organization.
In the "Assets" part, information about the assets that are currently in focus, is provided. This indicates the proportion of assets actively being utilized or monitored out of the total available within the user’s organization.
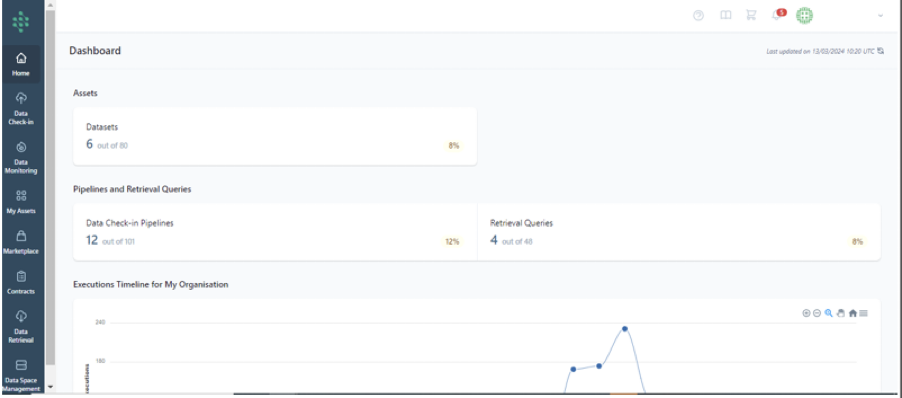
Under "Pipelines and Retrieval Queries," the dashboard highlights the engagement with Data Check-in Pipelines, indicating the pipelines that are currently in use, together with a respective percentage. Additionally, it indicates the number of Retrieval Queries performed, alongside with the respective percentage.
The "Executions Timeline for My Organisation" section provides a dynamic view of the organization's data processing activities over time. Users can zoom in or zoom out in specific time areas to get additional information over the activities performed. And they can also download this graphical representation in .SVG, .PNG, or .CSV formats.