Monitoring the Analytics Pipelines Execution
As a user of the platform, you should be able to easily monitor the execution of the data analytics pipelines in order to track any problems/incidents. In more details, you can track information about:
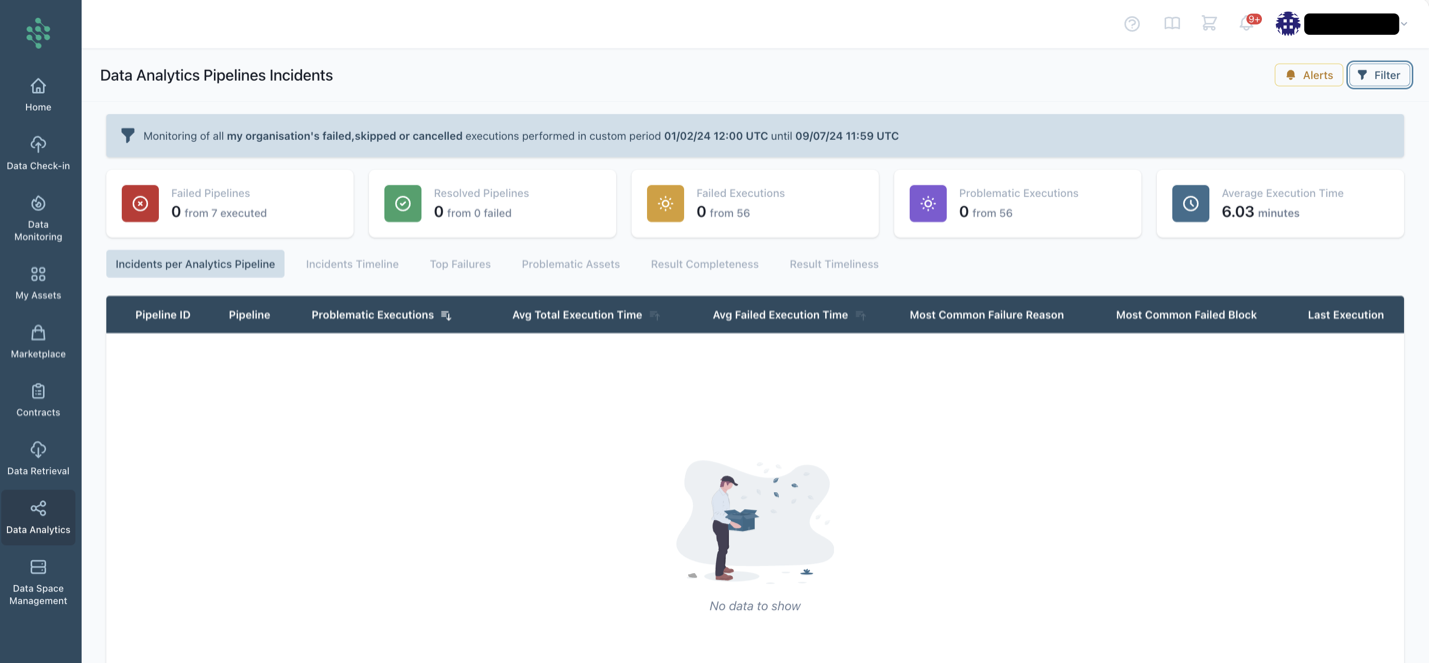
- Incidents per Data Analytics Pipeline where you can view a summary of the executions for the selected period, including the pipeline id, the pipeline title, the number of failed normal run executions vs total normal run executions, the number of cancelled normal run executions (for finalized pipelines) vs total normal run executions
- Incidents Timeline where you can view the pipelines based on: Last execution datetime, Pipeline id, Name, Incident Reason, Failed Block
- Top Failures where you can view the Failure, the Relevant Block it appeared, the Occurrences, the Affected Data Analytics Pipeline (s), the First Occurrence, the Latest Occurrence
- Problematic Assets where you get an overview of the problematic assets that may affect multiple of your data analytics pipelines
- Result Completeness where you may view the volume, the reliability, the number of columns along with the column-level and type-level consistency aspects and the total completeness of your results.
- Result Timeliness where you are informed about the timeliness, the last successful execution, and additional details (e.g. whether the pipeline from which the specific result is derived runs on new data or on a trigger related to input assets).
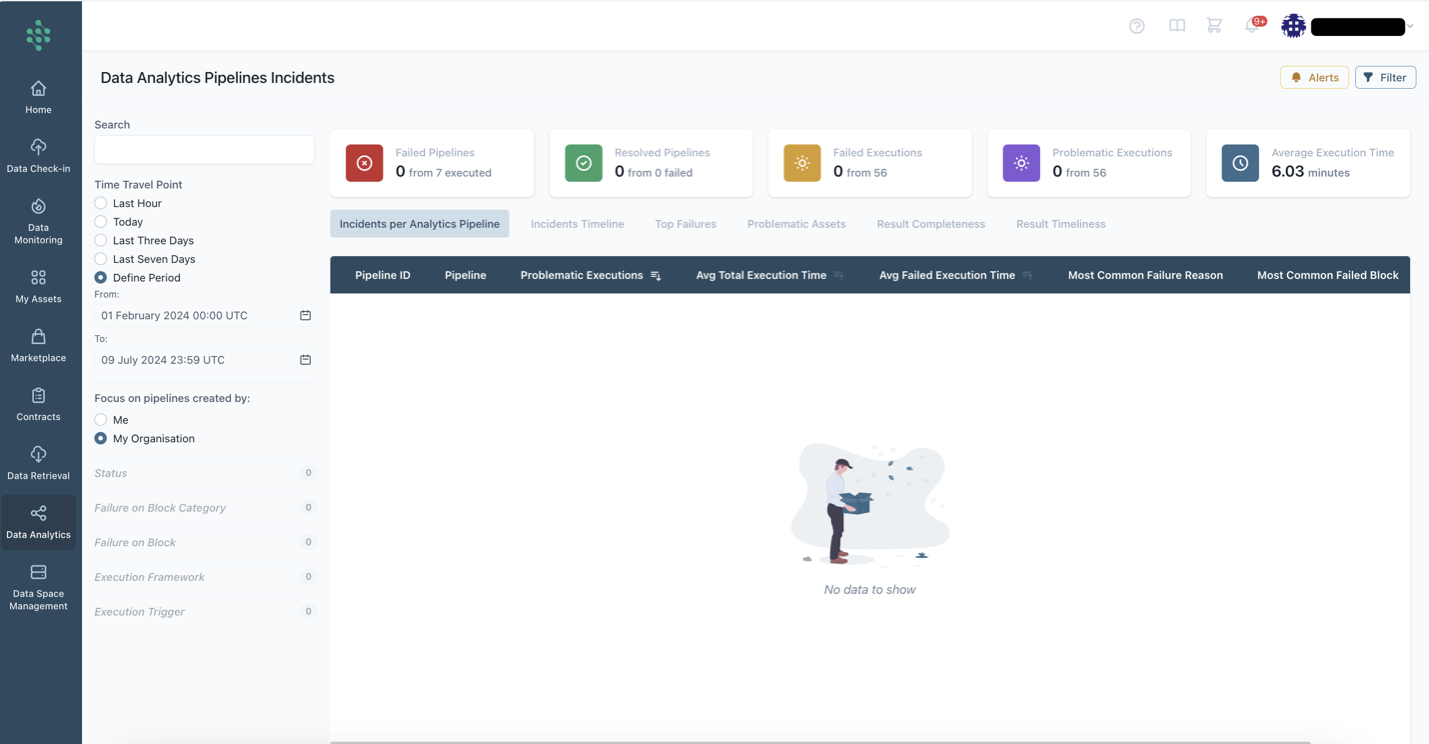
The summary KPIs that appear on top in the Monitoring page (that is accessible through a corresponding button in the Data Analytics Pipelines list page) include: Failed Pipelines (Unique Count), Resolved Pipelines (Unique Count), Failed Executions, Problematic Executions, Average Total Execution Time.
Through the filters menu you can filter the analytics pipelines execution by: Search, Time Travel Point, Focus on Pipelines created (by me vs my organization), Failure on Block Type (Training, Applying, Evaluating a ML Model, Data Preparation, Input/Output), Execution Type (Normal Run vs Test Run).
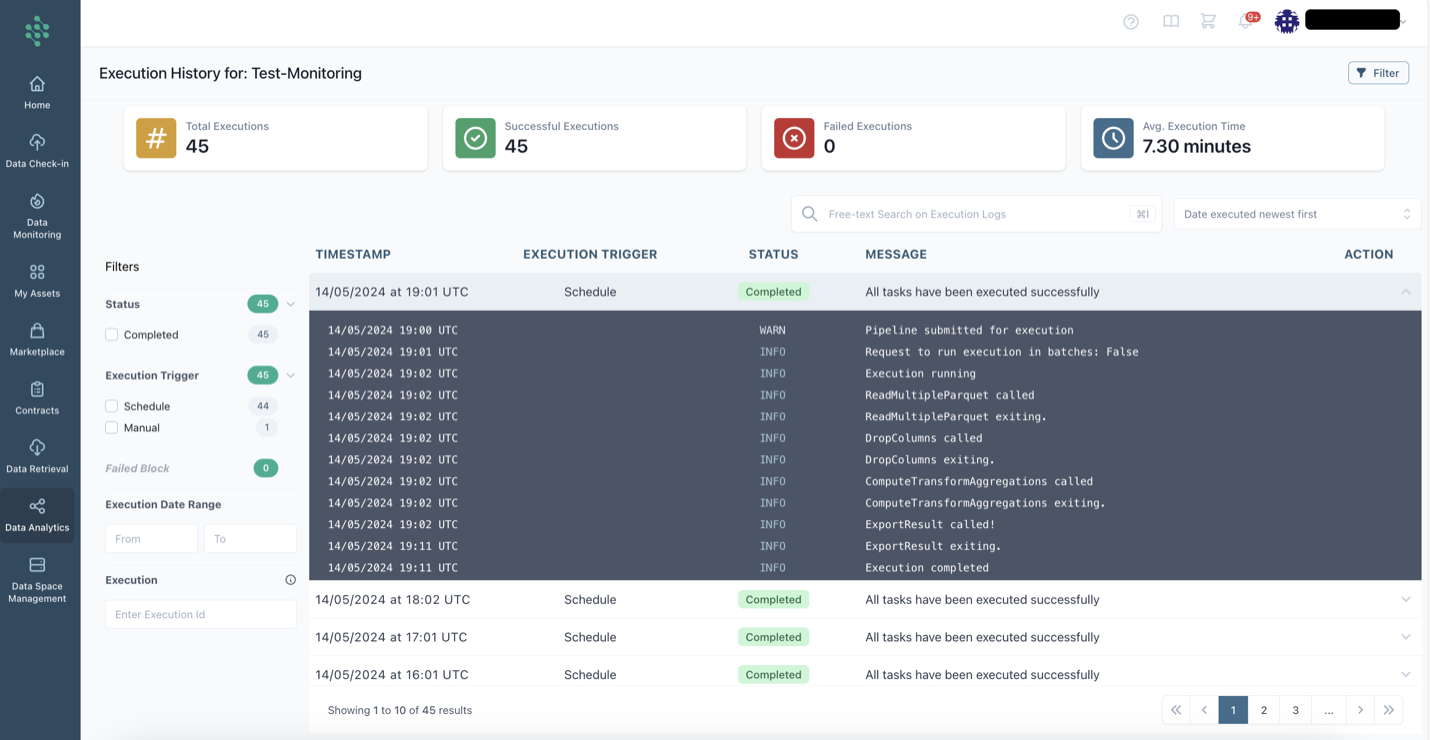
View the Detailed Execution History
By selecting the Execution History option for a specific Analytics Pipeline, the execution logs will be displayed as depicted in the figure below. In this view, you can observe the execution summary, including the total number of executions, successful executions, failed executions, and the average execution time. Additionally, detailed information regarding each execution, such as the execution timestamp, the execution trigger, the status, and related logs/messages, can be viewed below.