View Data Check-in pipelines
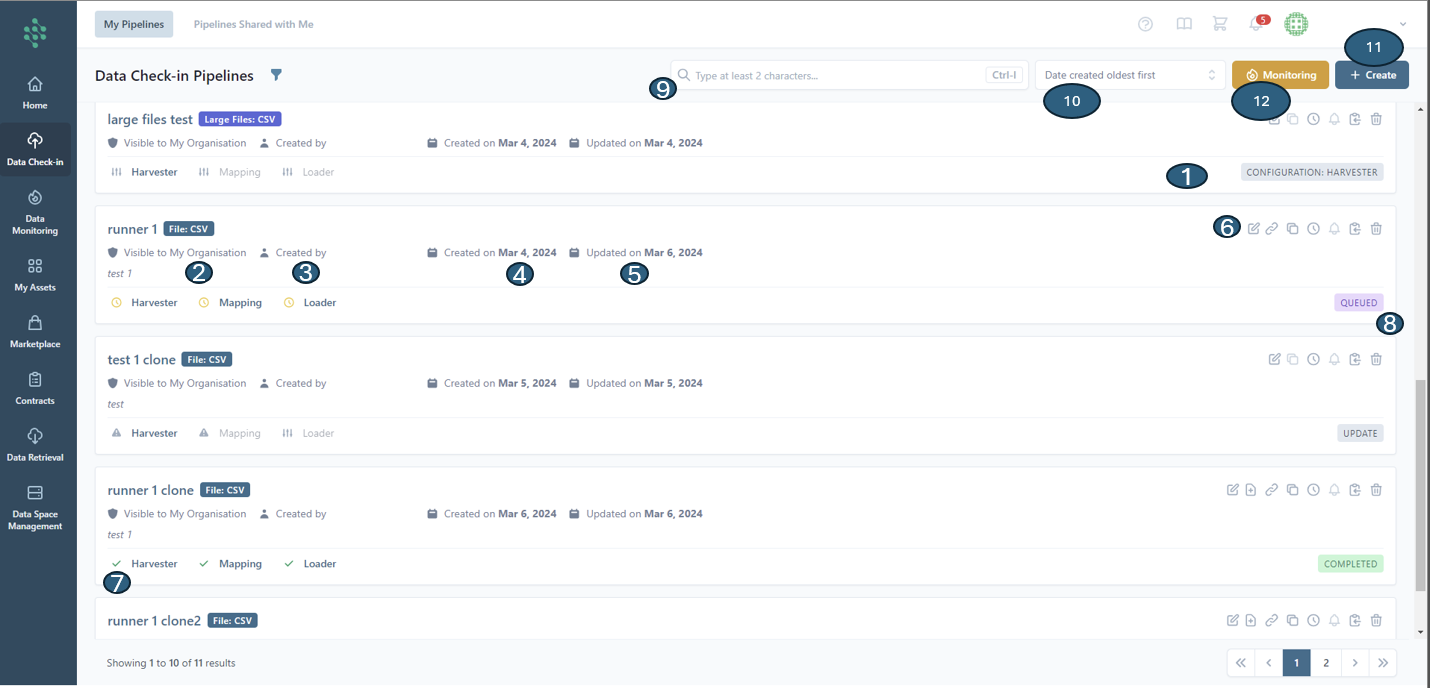
In the Data Check-in tab, you will find a concise summary listing all the data check-in pipelines that have been created or configured by members of your organization, as illustrated in the figure below. This list view offers comprehensive details about each data check-in pipeline, including its execution status (1), visibility levels (2), the creator of the pipeline (3), its creation (4) and last update dates (5), and a set of actions (6) you can perform, such as:
- Editing a Data Check-in Pipeline
- Appending data to a Batch File Check-in Pipeline (specific to Batch File Check-in Pipelines)
- Deleting a Data Check-in Pipeline
- Viewing Execution Logs for a Data Check-in Pipeline
- Navigating to the resulting Asset of the Data Check-in Pipeline
- Cloning the Data Check-in Pipeline
- Copying the Pipeline ID to the clipboard
Specifically, after a data check-in pipeline has been executed, icons such as a tick mark, a cross mark, or an exclamation mark, (7) will be displayed next to each data check-in step (Harvester, Mapping, Cleaning, Anonymization, Encryption, Loader). These icons indicate whether the execution of that particular step was successful, encountered an error, or needs to be updated due to incorrect configuration, depending on the steps applicable to the given pipeline. If a data check-in pipeline has not been executed and is queued (8) for execution, a clock icon will be displayed to indicate its status as pending execution.
You may look for specific pipelines using the search bar (9) and can organize their your view by sorting (10) according to the data check-in pipeline's title, its execution status, the date it was created, or when it was last updated. Furthermore, you can initiate the creation of a new data check-in job for uploading new data to the SYNERGIES Platform via a dedicated button located in the top right corner of the page (11). The monitoring button (12) directs you to the "Data Monitoring" tab, offering a detailed overview of their data check-in pipelines, being able to quickly identify and rectify any incidents, thus guaranteeing the seamless processing of data within the platform.
You can also access Data Check-in pipelines that have been shared with you by other members within their organization, even if you were not the ones to create them, through the “Pipelines Shared with Me” tab.
Hint
You are able to look up data check-in pipelines, whether created by you or shared within your organization, by utilizing various filters accessible through the filter panel icon. These filters are designed to streamline the search process:
- Pipeline ID: This filter enables you to locate specific pipelines by entering or copying (as indicated above) a unique pipeline ID.
- Status: You can filter pipelines based on their current status to quickly identify pipelines that are completed, failed, in configuration, suspended, or idle.
- Processing Steps: You can filter pipelines based on their current status to quickly identify pipelines that are completed, failed, in configuration, suspended, or idle.
- Harvesting Option: You can filter based on the data harvesting method employed, whether it's file-based, for large files, via Data Provider API, Platform API, or Platform Kafka
- Execution Location: Distinguishes pipelines based on where they are executed, offering choices between cloud-based or on-premise executions.
- Date Created Range: By setting a creation date range, you can narrow down the search to pipelines created within a specific timeframe.
- Date Updated Range: Similarly, pipelines can be filtered by the range of their last update, helping you to find the most recently modified pipelines.
- Scheduling Option: You can search pipelines based on their scheduling status, whether it's real-time, an active schedule, schedule expired, future execution, or no schedule.
- Schedule Horizon: This allows for filtering pipelines that are scheduled to execute within a specific date range.
Hint
The possible statuses for your data check-in pipeline within the SYNERGIES EDS are as follows:
- Configuration: The pipeline is currently being set up or configured.
- Deprecated: The pipeline has been marked as obsolete because the related data asset has been deleted. You need to reconfigure the Loader’s step to make this pipeline active again if you wish to do so.
- Idle: The pipeline is inactive, with no tasks currently assigned for execution at a particular step.
- Pending: The pipeline's execution hasn't started yet on the Federated On-Premise Environment of your choice.
- Running: The pipeline is actively executing.
- Queued: The pipeline's execution is awaiting activation by an external trigger.
- Update: A specific step within the pipeline requires an update.
- Cancelled: If a pipeline's execution submission fails, all its steps are marked as cancelled.
- Completed: The pipeline has successfully finished executing, and the associated dataset is now accessible on the SYNERGIES platform. Failed: The pipeline's execution was unsuccessful. Detailed information regarding the failure can be found in the execution history section.